
Inputs
- Min Box Size – the minimum size of the indicator box;
- RSI Period – the period of RSI;
- RSI Vertical Shift – a vertical shift of the overbought/oversold areas. Added/subtracted from 50. For example, if the parameter is 20, the overbought area is above 70 and the oversold area is below 30. If the parameter is 30, the overbought area is above 80 and the oversold area is below 20;
- Take Profit – the value of take profit;
- Indent From High/Low – Distance from the bar extremes for placing stop orders and stop losses;
- Volume – position volume in lots.
Description
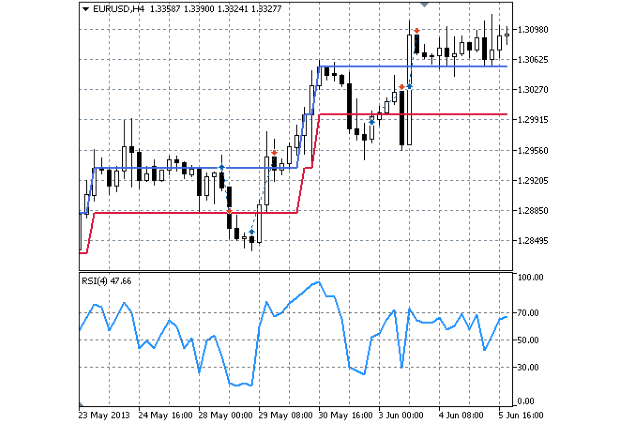
The idea is quite simple – Renko Line Break determines the direction of the trend, and then, on the rollback of the trend place a stop order based on the signal of RSI. Here is an example:
- Renko Line Break tells you that you are in an uptrend;
- if the RSI moves down into the oversold area, place a buy stop above the bar maximum. A stop loss a few pips below the lowest minimum of the last three bars, and a take profit in accordance with the parameter set by a trader;
- if the order does not trigger, and on the next bar RSI is still in oversold, delete the previous order and place a new order;
- if the the buy stop triggers, the position will be closed either by a stop loss, or on a trend reversal detected by Renko Line Break, or by a take profit, or if the RSI enters the overbought area;
- if the buy stop does not work and Renko Line Break changes the trend direction, then delete the order.